FROM
Manual steps
TO
Working systemData science · analytical tools · automation
From simple analysis to advanced tools.
Data science built around your questions—from a focused analysis or Python tool to statistical models, machine learning, automated workflows, and interactive 3D visualization.
The capability stack
Start with the question. Prepare the data, explore the answer, and build a tool people can use.
Data science at work
Chapter visuals pair working demos with illustrative workflows. All data is synthetic.
01 / BUILD
From a focused Python script to a custom application, make analysis useful in everyday work.
02 / CONNECT + AUTOMATE
Prepare, validate, and connect data. Automate the steps that keep analytical work moving.
Inside the working dashboard
Synthetic orders, costs, and dates.
Validate the schema and reconcile totals.
If a check fails → Stop. No metrics are displayed.
Revenue, direct cost, and direct profit from checked data.
Charts and tables show the same underlying values.
Illustrated processing path · Synthetic data · Runs in your browser
Explore the dashboard03 / SEE + DECIDE
Explore patterns with statistics and visualization. Use machine learning and AI where they help answer the question.
Working demo · Synthetic data
13 complete weeks · Fictional operating business
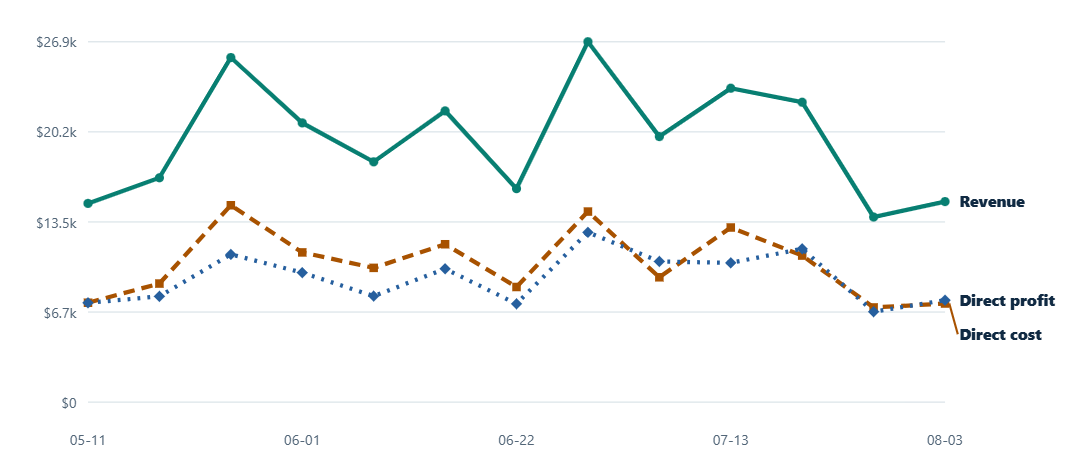
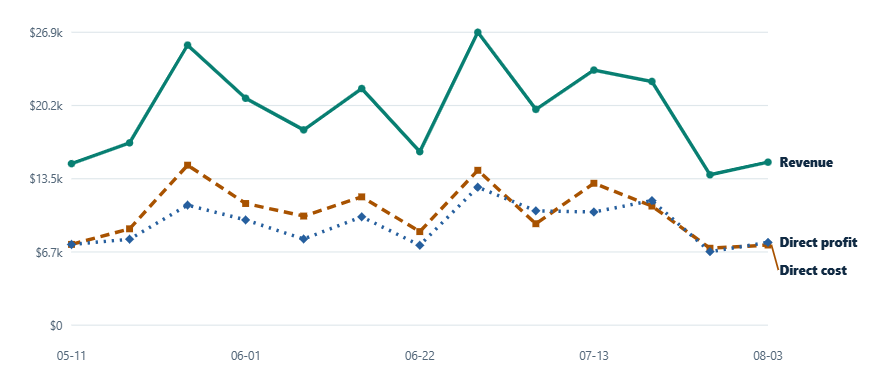
Weekly revenue, direct cost, and direct profit from the interactive demo. Direct profit is revenue minus direct cost, not net income.
Sources and assumptions stay visible. A person makes the decision.
What we design toward
Transformation patterns, not unverified client claims.
FROM
TO
Working systemFROM
TO
Shared signalFROM
TO
Evidence-based decisionFrom simple to complex
Working demos and labelled workflow concepts. All example data is synthetic.
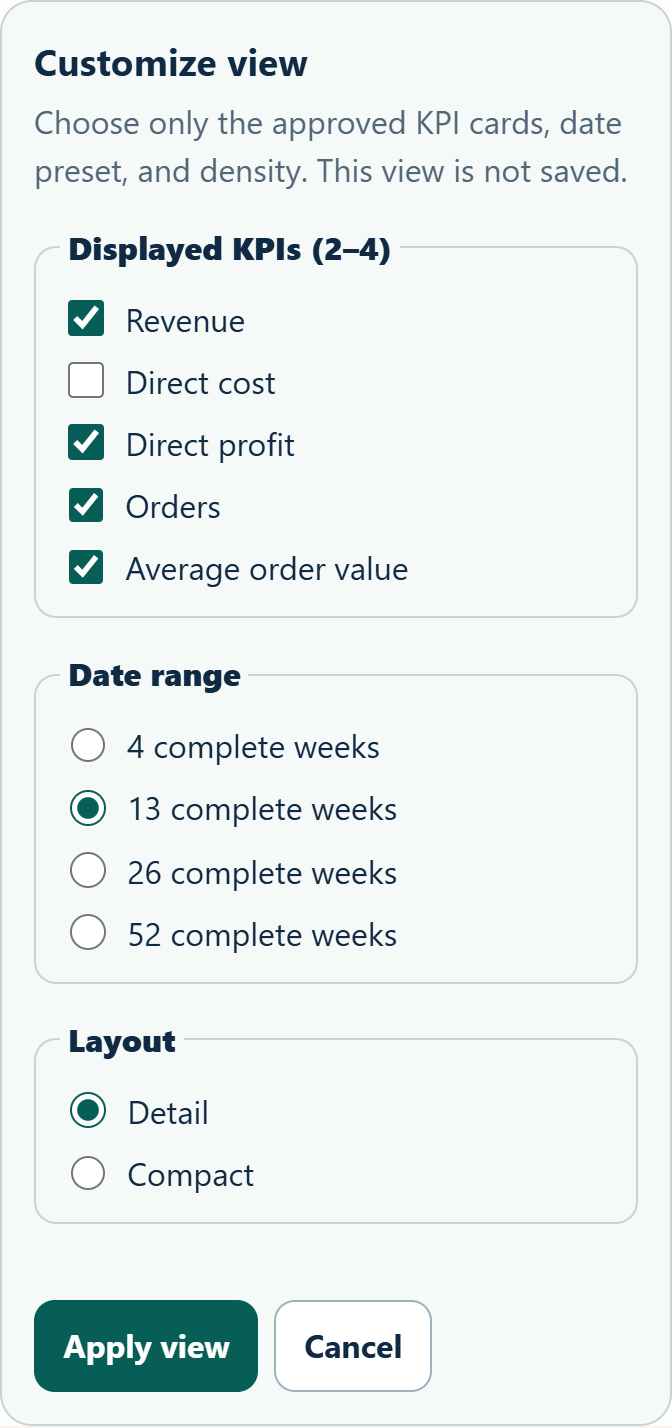
Choose KPI cards, date range, and layout in the working Business Dashboard. Synthetic data.
Explore the dashboardIllustrative workflow: collect answers, calculate scores, review findings, and assemble a report.
The dashboard’s actual processing path: generate data, validate it, calculate metrics, then show charts and tables. Failed checks withhold the output.
Actual VTK sampler output: 24 generated bins, with 10 flagged below the illustrative 35% level. Synthetic inventory, shown for review.
A concept workflow: sources support a draft, a person reviews it, then chooses to approve or revise.
A short Python analysis flags five days in synthetic operating data for human review.
How we work
Start with one valuable problem. Deliver a working result. Expand when the value is proven.
Relevant experience
People behind the work
Professionals who have worked with Alex Molinar across data science, energy, software, and operations describe the same focus: understanding the problem and building something useful.
Data science
“… one of the most naturally talented data scientists I've ever worked with.”
Workflow improvement
“His ability to quickly assess, improve, and revolutionize workflows and products brought immense value to our team.”
Business intelligence
“His impressive knowledge of the oil and gas industry combined with his determination to excel led him to create valuable BI analysis that helped grow the company and improve operations.”
Personal recommendations about Alex’s work across his career, shared on LinkedIn.
Read more recommendationsFree consultation · Flexible scheduling
Start with one useful question—simple or complex. We’ll help find the practical next move.
Free Consultation hello@dallasdigitaldata.com Please do not include passwords, credentials, private exports, or other sensitive data in your first email.